Your Team Isn’t Strapped. You Have Hidden FTEs. A Step-by-Step Framework for Discovering Capacity Hiding in Your Existing Client Portfolio

The Problem Every Agency Leader Knows
You’ve heard it before. Maybe you’ve said it yourself:
“We can’t take on new work—the team is at capacity.”
“We need to hire two more people before we can grow.”
“Everyone is maxed out.”
And yet, when you look at the financials, gross margins are underwhelming. If the team is working this hard, where’s the profit? If everyone is maxed out, why does the P&L look like there’s room to spare?
The uncomfortable truth: in most agencies I’ve worked with, the team isn’t actually at capacity. They’re overservicing existing clients. The hours are real—people really are working hard—but the hours aren’t aligned with what the client is paying. The result is a team that feels strapped while the business leaves capacity (and margin) on the table.
I call these hidden FTEs—the full-time-equivalent capacity that’s buried inside your existing portfolio, potentially recoverable without hiring a single new body. You just have to know where to look.
This guide lays out the analytical framework I’ve used for years to find them. It works for SEO agencies, creative shops, consulting firms—any services business where people deliver hours against client contracts.
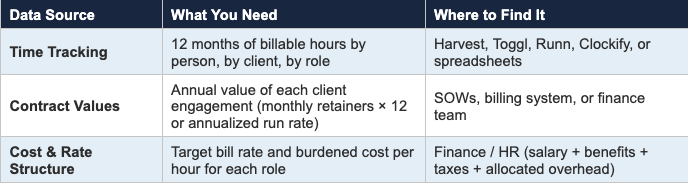
What You Need to Get Started
The analysis requires three pieces of data. You may already have all of them—they’re just not connected.
The Framework: Five Steps to Finding Hidden FTEs
Step 1: Establish a Blended Target Bill Rate
Before you can say whether a client is using too many hours, you need to define what the right number of hours looks like. There are two approaches to this that I refer to as: “low fidelity” and “high fidelity”.
The low fidelity approach starts with a blended bill rate—the weighted average of your bill rates across roles, weighted by the target percentage of hours each role should represent. This approach is good if it’s your first stab at this kind of analysis and you don’t have a pricing calculator that gives you a ground-up mix of target project hours, by role and bill rate, tied to SOW value. That’s the high-fidelity approach.
This guide assumes low fidelity: you have the projects you have–signed and running–and you want a good place to start.
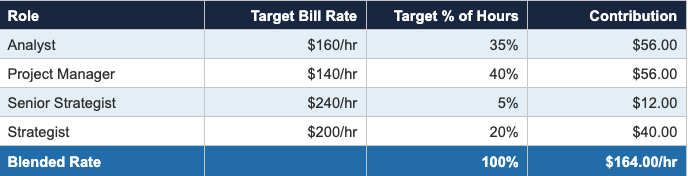
The target role mix is a business decision: it reflects how you want to staff your engagements. If you don’t have a formal target, use your current actual mix as a starting point—you can refine it later. And note well something I learned the hard way: that mix of Target % of Hours almost certainly will not be the same for small projects and large/jumbo projects. It’s still a good place to start (i.e. “something” > “nothing”).
Key insight: I’ve seen agencies price from cost, not from value. If your Analyst rate is based on what you pay your analysts (cost-plus), especially if you use off-shore resources, you’re almost certainly underpricing. Low rates create no natural constraint on hours—the team can throw analyst time at a problem because the client never feels the cost. This can be a huge driver of hidden capacity loss.
Step 2: Calculate Hours Budget Per Client
With a blended rate in hand, establishing the target hours, or hours budget, for each client is simple math:
Target Annual Hours = Annual SOW Value ÷ Blended Rate
A $72,000 annual SOW at a $164/hr blended rate should consume about 439 hours per year. If the team is logging 609 hours against that client, they’re 170 hours (39%) over budget.
Do this for every client. The output is a simple table:
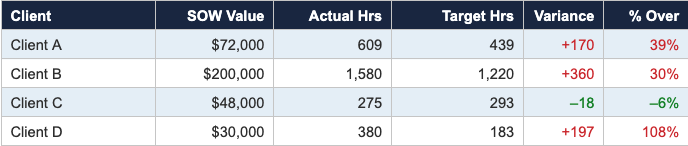
What you’ll find: In every agency I’ve analyzed, 20% to 50% of their clients are over their hours budget. The overages are rarely small. It’s common to see clients consuming significantly more hours than their SOW supports.
Step 3: Score Your “Problem Children”
Not all misalignment is created equal. A small client 50% over hours budget could be less urgent than a large client 30% over budget. You need a way to prioritize.
I use a composite score that combines three dimensions:
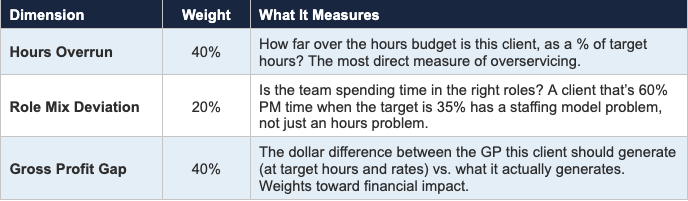
The composite is then multiplied by SOW value, so larger accounts with the same severity score higher. This reflects a simple truth: fixing a $200K account that’s 30% over budget recovers more capacity than fixing a $30K account that’s 100% over.
Normalize the scores to a 0–100 scale (worst account = 100) and rank them. Your top 10–15 are the accounts to dig into first.
What to look for: Are the problem children clustered around specific team leads? Specific roles like strategists? Specific client sizes? The patterns matter as much as the scores. If one strategist’s accounts dominate the problem list, that’s a process issue, not an account issue. If small legacy accounts are consistently over budget, that could be a pricing issue.
Step 4: Calculate Your Hidden FTEs
This is the headline number that gets a CEO’s attention.
For every client that’s over their hours budget, calculate the excess hours: Actual Hours minus Budget or Target Hours. Then attribute those excess hours to the people who worked on that client, proportional to their share of the client’s total hours.
For example: if Client A has 200 excess hours and Sarah did 40% of the work on Client A, then 80 hours of Sarah’s time is “recoverable”—it’s being consumed by overservicing. Note again that “overservicing” is relative to what Client A is paying you. It’s possible that fees are too low.
Sum up the recoverable hours for each person across all their over-budget clients. Then convert to FTEs using a standard benchmark (for example, 1,600 billable hours per year is typical).
Hidden FTEs = Total Recoverable Hours ÷ 1,600
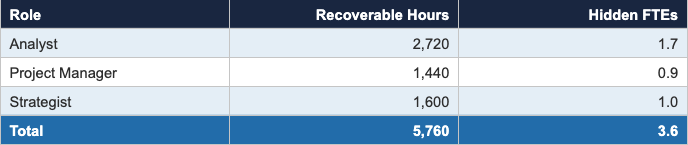
The conversation this enables: “You told me you need to hire 3–4 people to take on new work. But I found 3.6 FTEs of capacity hiding in your existing portfolio. You don’t have a headcount problem—you have an hours discipline problem. Let me show you exactly where it is and how to get it back.”
Step 5: Build Get-Well Plans
The analysis tells you where to look. The remediation requires going deeper—client by client, account by account—to understand why the hours are what they are and what can change.
Should the Hidden FTEs be driven to zero? NO! You need slack in the system: folks get sick, go on leave, get promoted, leave your company. You need to understand how much excess capacity is healthy and necessary. But beyond that is opportunity.
Questions to Ask for Each Problem Child
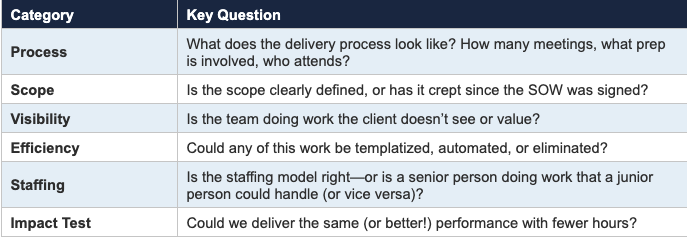
The goal isn’t to cut corners. It’s to deliver the same value in fewer hours—which is only possible if you understand where the hours are going and which ones are actually creating value for the client.
The harder conversation: Sometimes the answer isn’t “do less”—it’s “charge more.” If you’re delivering $160/hr of value but billing at $52/hr, the math will never work no matter how disciplined you are with hours. The hours budget analysis sometimes becomes the business case for a pricing overhaul.
Putting It All Together
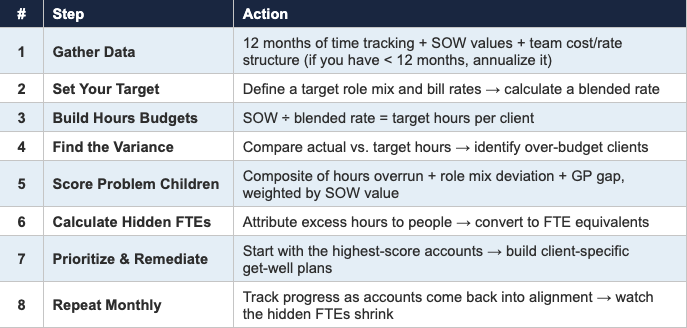
The beauty of this framework is that it’s self-reinforcing. The hours budget gives teams a concrete target. The problem children scoring tells leadership where to focus. The hidden FTE number motivates action. And as accounts come back into alignment, the capacity freed up becomes visible—either as margin improvement, ability to take on new work, or both.
Why This Works (When “Just Track Your Time” Doesn’t)
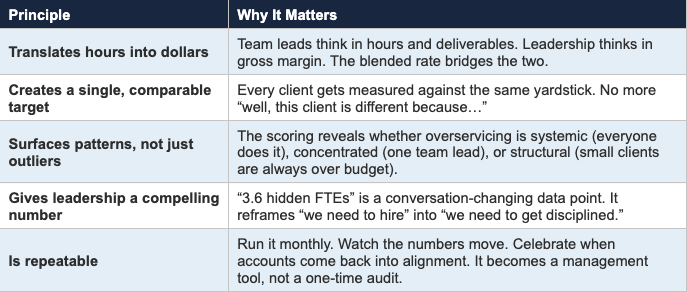
Lots of agencies tracks time. Very few agencies connect time data to financial outcomes at the client level. The gap between “we track hours” and “we manage hours against budgets” is where the hidden FTEs live.
This framework works because it:
Common Objections (And How to Handle Them)
“But every client is different—you can’t use one blended rate.”
You’re right that every client is different. But if you can’t define a target, you can’t identify a problem. The blended rate is a starting point—a way to quickly scan the portfolio and find the accounts that are most out of alignment. Once you identify the problem children, you go deeper with client-specific analysis. The blended rate is the triage tool, not the diagnosis.
“Our team really is at capacity—they can’t work any less.”
The analysis doesn’t claim people aren’t working hard. It claims they’re working hard on the wrong things—or that the work they’re doing isn’t being valued correctly in the pricing. If someone is spending 40% of their time on over-budget accounts, bringing those accounts to budget doesn’t mean they work less. It means the work they do gets redirected to higher-value activities.
“We can’t cut hours without hurting quality.”
This is a very common objection in my experience, and it’s worth taking seriously. But in practice, the excess hours are rarely all high-value. They’re prep and debrief meetings that could be shorter, reports that could be templatized, status calls with too many agency attendees, responding to client ad hoc requests, or rework from unclear scopes. The get-well plan process identifies which hours are value-creating and which aren’t.
“Our pricing is competitive—we can’t charge more.”
Competitive compared to what? If you’re pricing based on your cost structure (cost-plus), you’re anchoring to the wrong number. The question isn’t what it costs you to deliver—it’s what the client would pay for the outcome. Agencies pricing on value can target 65% account gross margins. Agencies pricing on cost can struggle to break 50%.
The Bottom Line
If your team feels maxed out but your margins don’t reflect it, you almost certainly have hidden FTEs. The capacity is there—it’s just being consumed by overservicing, underpricing, or both.
The “low fidelity” framework to find it is straightforward: define what “right” looks like (target rates and role mix), compare actual hours against that target, score and prioritize the accounts that are most out of alignment, calculate the FTE-equivalent capacity hiding in the overages, and build account-level plans to close the gap.
The hardest part isn’t the math. It’s the willingness to look at the data honestly and have the conversations it demands—about pricing, about process, about what “good” looks like. But those conversations are exactly the ones that separate agencies that grow from agencies that grind.