The Numbers are Right, and That’s the Bad News: Clearing the Financial Fog in 2026
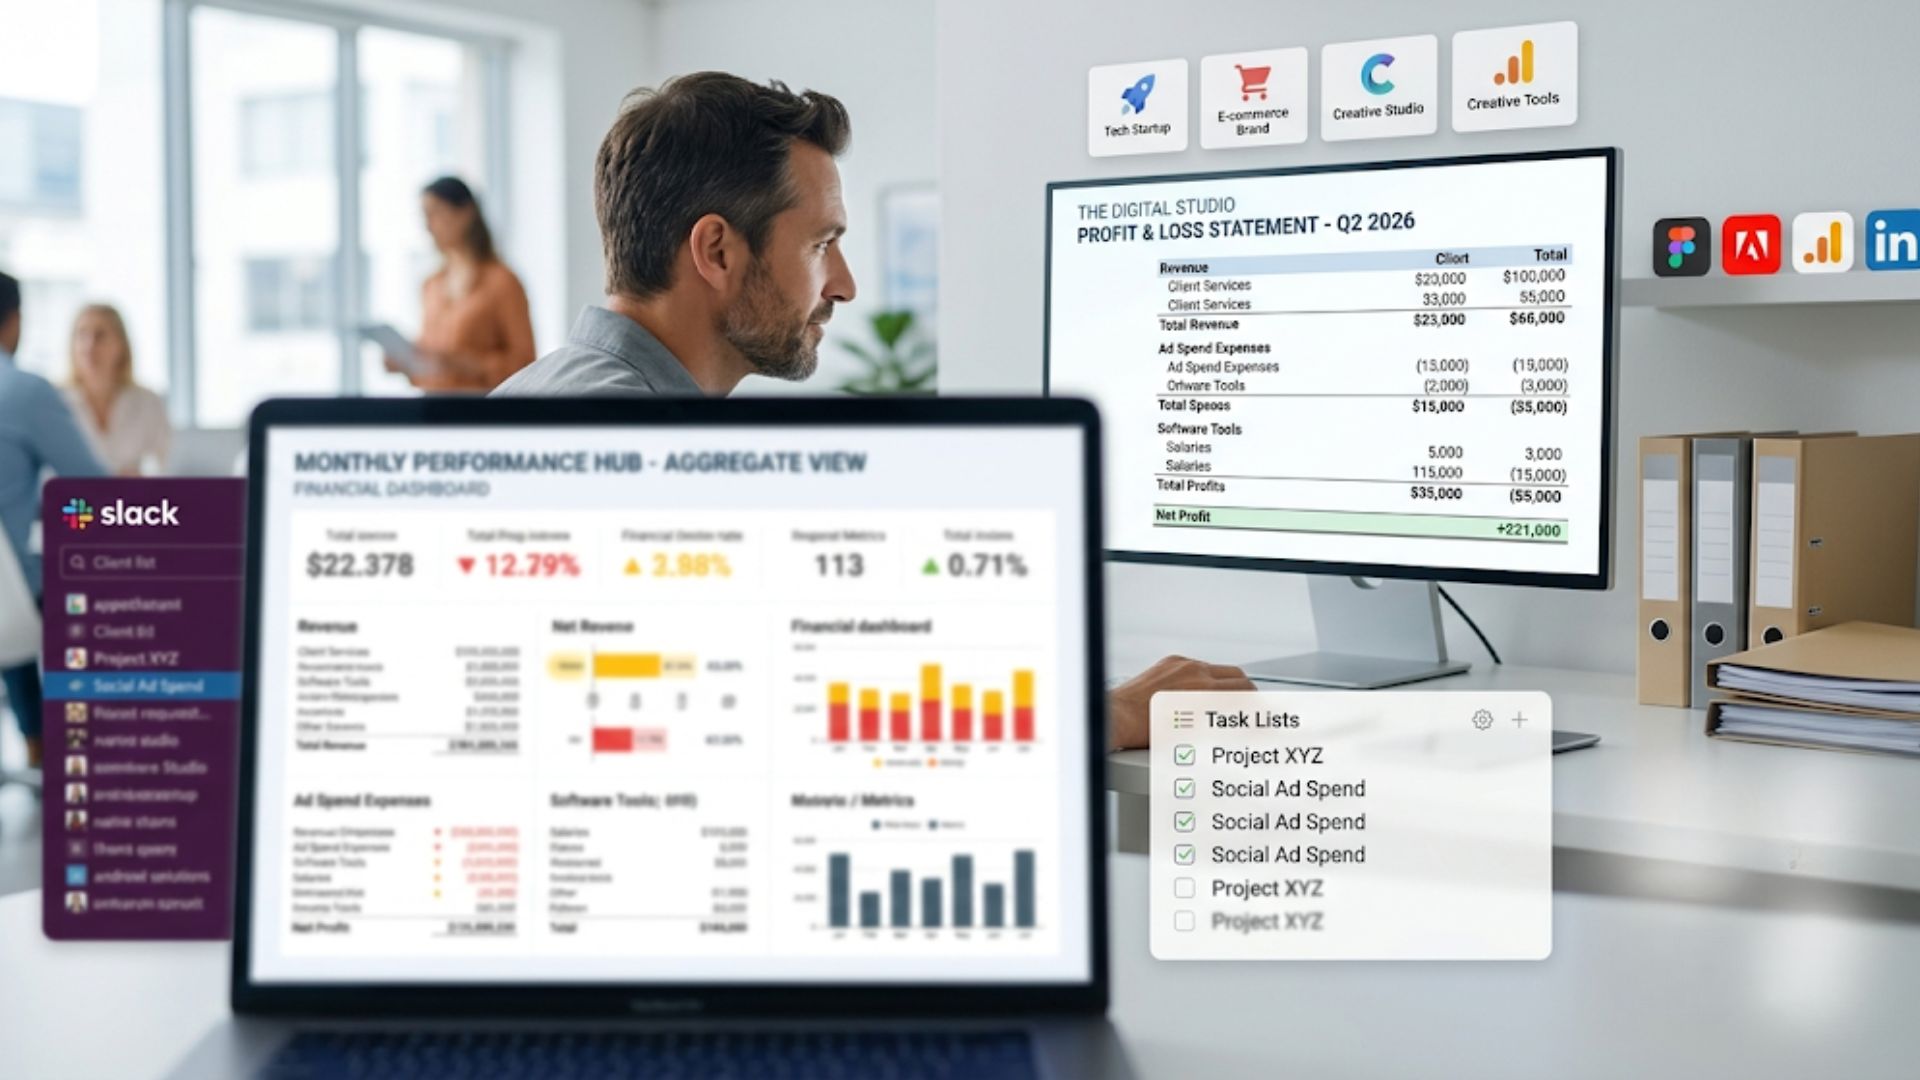
When a business partner and I bought a $20MM revenue retailer in the travel and leisure space, we brought in a forensic accountant to help us get our arms around the financials and cash flows. The business was complex and it took a LOT of work to nail down what was going where and why in the financials. For several months we were operating the business in a financial fog and it was anxiety inducing, TBH.
Sound familiar, agency owners?
For agencies generating $2M to $15M in annual revenue, financial clarity can feel just as elusive. Sure, your bookkeeping might be accurate enough to satisfy your accountant at the end of the year. But is it useful for running your business day-to-day?
If your firm struggles to predict cash flow, plan hiring confidently, or spot early signs of team burnout, the reality might be this: Your numbers aren’t telling the full story.
Here’s how you can overhaul your agency’s financial systems and weaponize your profit and loss (P&L) statement to drive smarter, strategic growth in 2026.
The Forensic Accountant’s Paradox: When Accurate Becomes Useless
Some agencies rely on cash-basis accounting instead of accrual for their financial reports. And while these statements may be correct and blessed by your accountant, they can hinder your ability to diagnose issues in your business. Some agencies don’t compare monthly performance to a budget, or track their team’s time.
Fog.
This missed opportunity hits the hardest in two areas: labor allocation and diagnosing profitability anomalies. To be clear, there’s nothing wrong with looking at the bank balance each week and watching it go up and down. But that’s actually a massively lagged KPI (bank cash balance), and one not often tied to agency activity in the month you’re in. Also, as you scale up and complexity increases, using the cash balance to guide your actions would be like driving a car on a windy road by looking through the rearview mirror.
For example, I’ve found that agencies sometimes classify principal labor—and even sizable delivery-supporting software—as general overhead. But that masks how much you’re really spending to deliver services. It’s like reporting $1MM in gross profit at 80% gross margins, but having $400K in “hidden delivery costs” down in Sales, General and Administrative expenses (SG&A). Note that Net Income is the same either way, but how you view the efficiency of your solution delivery processes would be very different. There’s no wrong doing here, just a P&L set up that has been outgrown as the business scaled up.
Understanding true operational margins requires shifting your financial lens. Basic cash in and cash out makes it easy to understand the business on one level. Basic management accounting, on the other hand, equips CEOs to make better resource decisions.
Why This Matters
Without management-level insight, agency leaders risk thinking they’re more efficient and profitable at the gross margin level than they are. True financial clarity comes from restructuring your P&L so it reflects operational reality.
Restructuring for Reality #1: Make the Move to Accrual Accounting
Accrual accounting recognizes revenue when it is earned (services are delivered) and expenses when they are incurred, regardless of when the cash actually moves.
This one sometimes makes CEO’s heads spin. On cash basis accounting, no matter what happens you know what cash you got in and what checks you had to write in any given month. Easy peasy. But cash flowing in and out is lumpy: clients might stretch you then pay several invoices at once.
On the expense side large quarterly payments can balloon month-to-month expense flows. If a large outflow happens to occur in a month when few receivables roll in, your P&L can look awful, even if things are actually doing well.
Tracking KPIs tied to Gross Margin, Revenue, or even Net Income is fraught as their values are a function of when clients happen to pay you or when you write checks not what your team did or didn’t do.
There comes a point in the development of the business where you just have to switch to accrual accounting for reporting. To understand where cash is going and where it’s coming from you need to also get your brain around the Balance Sheet and the Cash Flow Statement and how all three documents work together. And, the best help for this can be a part time controller or full time accounting manager.
Restructuring for Reality #2: Your True Gross Margin Revelation
One of the biggest culprits behind misleading P&Ls? Cost of Goods Sold (COGS).
Do you have the entirety of your delivery software, billable principal labor, and related expenses down in SG&A? In reality, these expenses directly support the production and delivery of services—and should sit squarely within COGS.
Agencies that restructure their P&L to reflect these delivery expenses often discover that their gross margins have been overstated. That’s not just an accounting glitch—it’s a financial blind spot that could distort your pricing strategy, hiring plans, and even the ability to handle client churn.
What You’ll Build
By reevaluating COGS, you’ll achieve a more accurate picture of your agency’s true gross margin. Benchmarks suggest that healthy agencies should aim for gross margins in the 60% range post-restructuring.
Time Tracking as Strategic Weapon, Not Micromanagement Tool
How much of your billable revenue is leaking out through seemingly minor inefficiencies? The answer could be 10–20%, thanks to what we call “touchpoint taxes,” or “parasitic loss” for the engineering inclined.
Touchpoint taxes are the non-billable activities—extra client communications, internal status updates, handoffs, re-work, follow-ups, ad hoc client requests, or other tasks borne out of inefficiency or overservicing—that chip away at your team’s billable hours. Without accurate time tracking, these taxes accumulate unnoticed and silently erode gross margins.
But time tracking offers more than leak detection. It reveals whether your key staff members are shouldering more work than they should. Utilization rates above 75% often correlate with burnout and dips in quality—warning signs you can address before they impact deliverables.
Why This Matters
Non-intrusive time tracking isn’t micromanaging; it’s surfacing reality. Used smartly, it creates visibility into whether you need additional resources, where efficiency gaps live, and how to prevent team burnout before it becomes costly turnover.
Weaponizing Your P&L: From Post-Mortem to Profit Driver
For many agencies, the P&L serves as little more than a periodic “post-mortem” report. It tells you what happened last month... but not what’s coming next month.
What if your P&L could do more? With the right restructuring, your P&L becomes a forward-looking tool—one you can use to:
Challenge the status quo. Use margin insights to innovate new offerings or overhaul underperforming service lines.
Forecast hiring needs. If metrics like Revenue per Headcount, Labor % of Revenue, and Utilization indicate higher workload demand, you can confidently make key hires without risking cash flow.
Deliver complete business intelligence. Integrate P&L data with KPI dashboards to illuminate how operational decisions affect financial outcomes. A past investor once told me, “eventually all management decisions end up in your numbers” and he’s right.
By connecting financial reporting directly to operational rhythms, leaders gain the strategic foresight needed to balance growth with risk mitigation.
Leading vs Lagging KPIs: Building Your 2026 Financial Radar
Most small to midsize agencies have a limiting dependence on cash-basis revenue and cash-in-bank as their primary performance metrics. Unfortunately, Relying on lagging indicators can lead CEOs to overlook early churn signals—leading to revenue downdrafts they could have prevented.
To avoid surprises, you need leading operational KPIs baked into your annual planning. Helpful indicators include:
- Revenue per Headcount. Track revenue for your solution team on an FTE basis (i.e. include contractors if you use them) for a high-level window into team bandwidth. Calculate team-specific Rev/HC to spot overwork trends before it leads to burnout.
- Labor % of Revenue. Gauge labor expense content (W-2 and contractors). Together with Revenue/HC and a couple benchmarks you have a quick and powerful set of leading indicators for Gross Margins
- Sales Coverage Ratio. Monitor the ratio of your discounted sales pipeline to your forward 3 month sales goals to gauge the likelihood of meeting your sales budget needs.
- Client Churn Rate. Your best client is the one you already have: opportunities for engagement expansion and referrals, and usually more profitable than a new client. All of that is out the window if they churn out. As a result, beating your budgeted client churn assumption is like money falling out of the sky.
What You’ll Build
With leading KPIs in your budget, you’ll be able to “see around corners,” predicting growth opportunities or churn risks 3–6 months in advance. This foresight allows agency CEOs to stay proactive—not reactive.
Don’t Settle for Accurate Numbers. Demand Useful Ones
The difference between an agency struggling to manage cash flow and one strategically executing bold moves in 2026 often boils down to financial clarity.
Cash-centric numbers are fine as a measure of rough business health. But lagged and lumpy cash performance numbers alone can’t drive confident decisions, refine operations, or signal when to grow (or when to stop).
By restructuring your P&L, tracking time strategically, and relying on leading KPIs, you can transform your financial reporting into a strategic weapon.
Here’s a quick checklist you can use to discover what your current P&L can tell you about your business:
The COGS Audit: Is every dollar of software and labor used to deliver client work sitting above the Gross Profit line?
The Principal Split: If you (the founder) spend 50% of your time on strategy for your top 3 accounts, is 50% of your comp in COGS?
The 2026 Budget Baseline: Do you have a month-by-month budget that compares actuals vs. goals and YTD vs. last year?
The Labor Map: Do you have visibility into which service lines (SEO vs. Paid) are the most labor-intensive relative to their revenue?
Ready to escape the financial fog? Drop us a line and tell us what you’re trying to see!