The 12-Element Client Risk Scorecard: Stop Managing Churn by Vibes
Are you running your agency based on intuition rather than data? You might be losing significant ARR to "leaky bucket syndrome" without realizing it until a cancellation notice hits your inbox. It’s time to move beyond managing churn by "vibes" and start using a structured, 12-element risk scorecard. In this post, we’ll show you how to turn your gut instincts into a normalized, actionable metric so you can track account health, identify early-warning signals, and stop being blindsided by client exits.
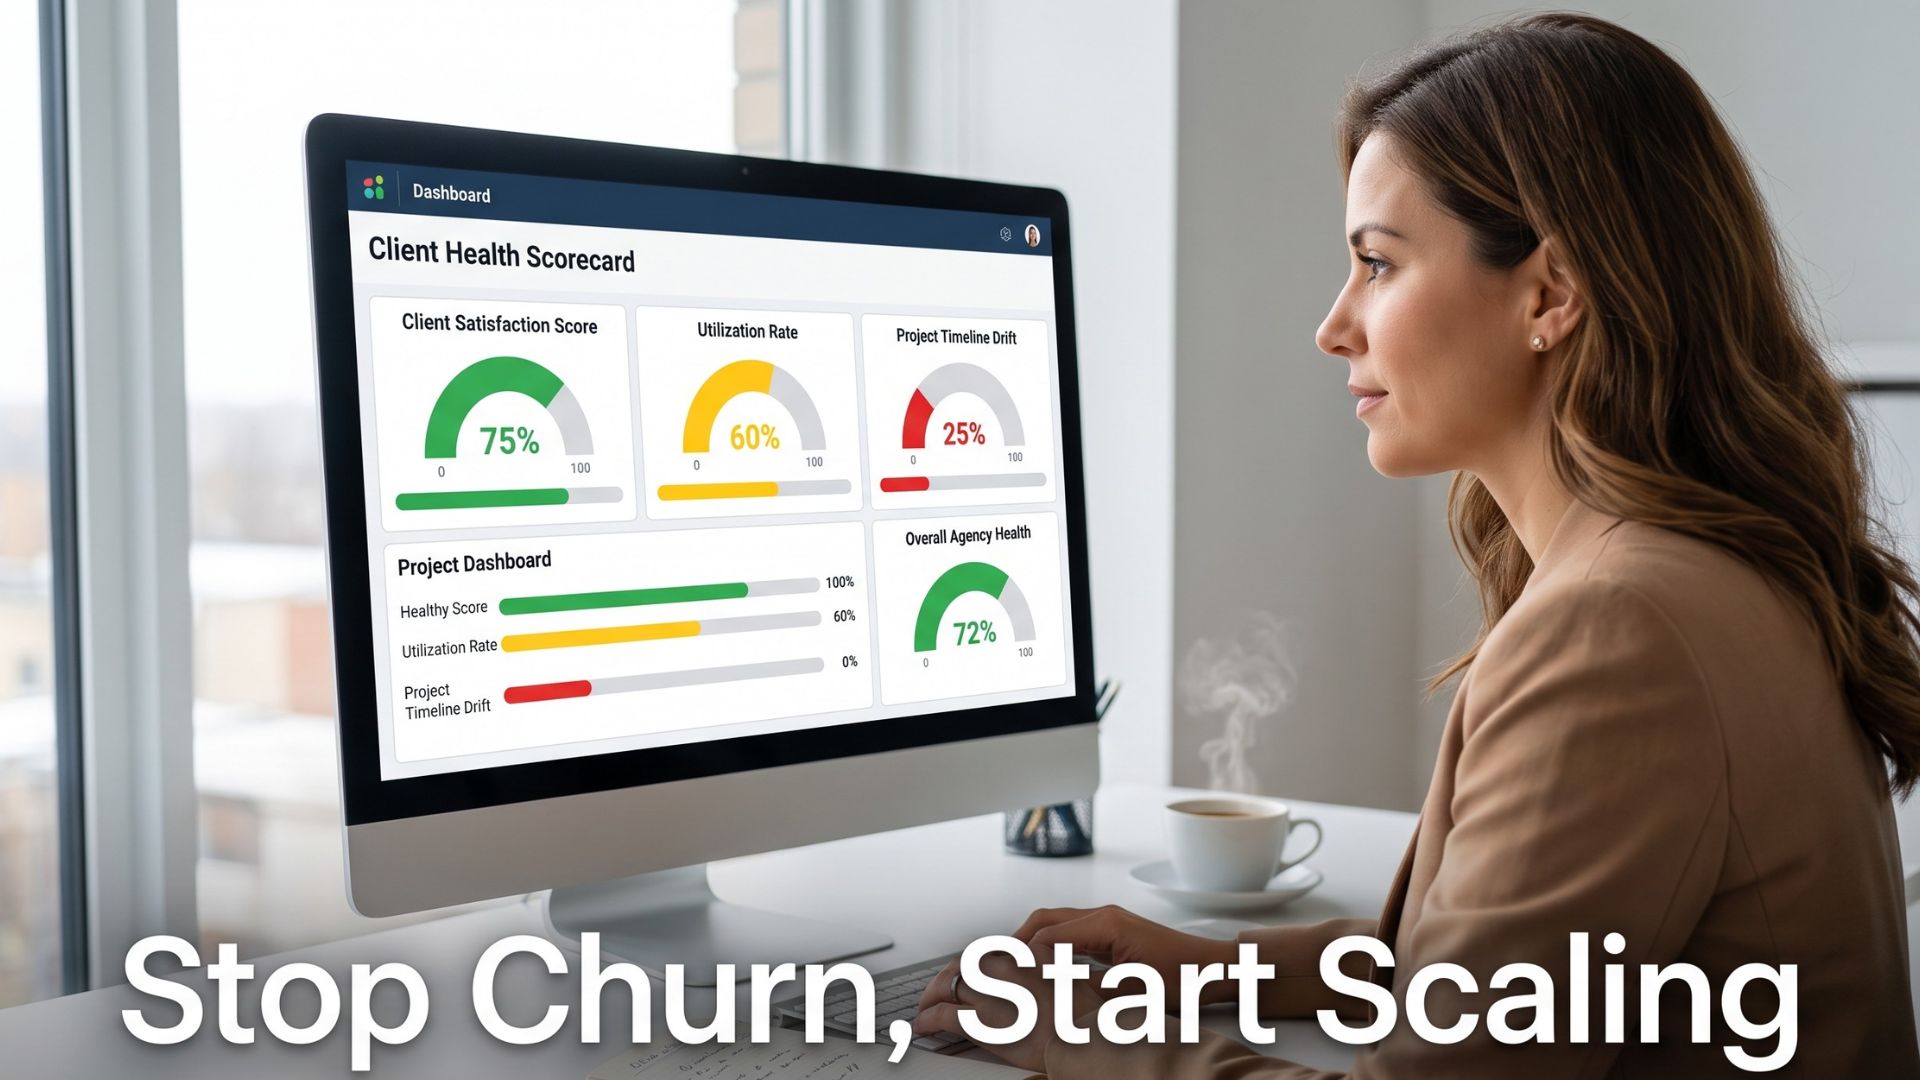
Professional services firms lose a significant share of their client base every year: a real chunk of the book, gone, year after year (see “leaky bucket syndrome”). And for many of our clients it happens without a single reliable early-warning system to explain why.
Take a sec to read that again. If you run a $3M agency, even losing 25% of that book is roughly $750K of ARR quietly walking out the door annually and you're finding out about it when the 30-day notice lands in your inbox.
Here's the good news / bad news part of it: churned clients often show identifiable risk signals well before they cancel. The data to see it coming is almost always there. It's just living in your gut instead of on a dashboard.
If that's you, you're not managing churn. You're waiting to be surprised by it.
Let's fix that. This is a step-by-step blueprint for building your own client risk scorecard: a tight, 12-element, weighted, normalized system that turns "I've got a bad feeling about that account" into a number you can track across your whole book of business, month over month.
Why Vibes-Based Risk Management Gets Founders Blindsided
You know the symptoms because you've lived them:
A client you thought was fine sends a termination notice, and you're blindsided.
Your read on account health is, at the end of the day, "how did that last call feel?"
A new VP of Marketing shows up on the client side and your stomach drops, but you don't do anything about it until it's too late.
Your churn rate is creeping up and you genuinely can't point to why. Or, (and this one is more pernicious) you or your team can justify/explain every one of them. Nodding heads all around but it still adds up to you running a 30% annual churn rate
Here's what I want you to hear: this isn't a caring problem. You care plenty. You've probably lost sleep over a key account. The problem is you don't have an instrument.
You're already making the "is this client at risk?" call constantly – especially for your top 2 or 3 accounts. You do it in the shower, on the drive to the gym, halfway through a status call. You just do it inconsistently, too late, and with no way to compare Client A to Client B, or this month to last.
Something I’ve learned over the years is: your gut is never wrong — it's just not 100% right. The goal isn't to replace your instinct. Your instinct is a useful data point. The goal is to capture it and standardize it so it scales past your own head and shows up somewhere your team can act on it.
Vibes don't go in an operating playbook. A KPI does.
The 12 Elements of Client Risk (In Four Buckets)
I want to head off a classic mistake first: do not build a 100-question monster client health questionnaire you require your strategists fill out every day. You’ll never fill it out, and neither will your team. Usable beats perfect here.
Here are the twelve elements across four buckets.
Bucket 1 — Financial (4 elements)
1. Performance against goals. Are we actually hitting established goals this client is paying for?
2. Gross-margin outliers. Is this account way over or under hours? An over / under serviced client is an unhappy relationship waiting to happen for both parties.
3. Budget stability. Is their budget with you steady, growing, or getting quietly trimmed?
4. Revenue concentration. What percentage of your revenue is this one client?
On that last one, I’ve lived by flagging no single client being more than 15% of annual revenue. Anything more than that needs close attention, because client concentration risk means losing one account can wreck your cash flow. That's not a churn signal about them; it's a risk signal about you. Score it anyway. It changes how hard you fight to keep them.
Bucket 2 — Strategic (2 elements)
5. Does a governing one-pager exist? Is there a shared, written strategy document that ties your tactics to their business goals for this account? Are you both making it up as you go? Or is it spelled out in a 3 year old SOW or 100 slide QBR deck somewhere?
6. Alignment to your unique value. Are you doing the work you're great at, or have you drifted into being a pair of hands?
Bucket 3 — Relationship (4 elements)
7. Senior decision-maker changes. New CMO, new VP, new Director, etc.. In my experience this is the single most common way strong accounts can stumble; often fatal.
8. Direct point-of-contact changes. Your champion is about to leave. Now what?
9. Account-team stability. Have you shuffled their account team three times this year? (If so — ouch. They noticed.)
10. Account-team sentiment. Does your team like working on this account, or do they groan when it comes up in 1:1? If so, why?
On relationship signals specifically: a contact who used to reply in hours but now takes days, or starts missing your regular check-ins, is an often cited early indicator of disengagement. That's a measurable thing. Consider measuring it.
Bucket 4 — Proactive (2 elements)
11. Are you seeing around corners for them? Bringing ideas, POVs, and performance insights before they ask (aka “unprompted updates), or are you just heads down in execution?
12. Have they referred you business? A client who sends you referrals is a client who's likely staying as they’re investing their own prestige with their network.
Notice that this isn't a survey you send the client. It's an internal doc that your team fills out honestly. That's the point and it could consist of elements that are captured weekly and others captured monthly.
How to Score It So a Busy Founder Can Read It at a Glance
Now let's turn those 12 elements into one number you can actually track and use.
Step 1: Define what "risk" means before you score anything. Something like: likelihood this client will churn in the next six months. Come to a working consensus with your team. Everyone scoring needs the same target in mind, or your data gets mushy.
Step 2: Pick a measurement method but don’t over think it. Yes/no, 1 to 10 (10 = “in place, happened, robust”, or whatever; 1 if the opposite). The goal is to make this easy enough so the exercise is not onerous for your team. I’m not covering compliance in this post, but that’s a major goal.
Step 3: Weight the elements that most predict churn. Not everything matters equally. IMO, your heaviest-weighted elements should be performance against goals, the governing strategy one-pager, proactivity, and revenue concentration. A missing senior decision-maker relationship should drop the score more than "hasn't referred us business yet."
Step 4: Normalize to 0 to 100. This is the move most people skip, and it's the one that makes the whole thing sing. When every account rolls up to a 0 to 100 score, the number means the same thing for Client A and Client B, and for this month versus last. You can track it. You can trend it. You can put it in a chart.
Where'd the weights come from? You can make them up and that's 100% OK. You'll calibrate all of this over several months as you watch which scores actually predicted the churn (or gut-level concern at any rate). The point isn't precision on day one. It's a consistent yardstick.
This founder-built 12-element scorecard will provide a lot of useful early-warning value with a spreadsheet. No fancy modeling required (that said, with enough time and data you could run correlations between risk scores and churn rates).
Turning the Score Into a Picture: Your Red/Yellow/Green Book of Business
A number per account is good. A picture of your whole book is where you can see at a glance what’s what.
Next, set your thresholds. Align on what "100" means before anyone touches a chart. For example:
85+ = Green. Healthy. Keep feeding it.
61 to 84 = Yellow. Drifting. Act now, not later.
Under 60 = Red. ON FIRE. This is where you really want to get involved.
Maybe as you normalize things you want to set the Red threshold at Under 70. Whatever makes the most sense for when you want to ring the alarm.
Then build one chart. A single monthly stacked bar showing what percentage of the SOW $ value is green, yellow, and red.
Note that you want to look at SOW value, not client count. Five small green accounts don't offset one giant red one. You care about revenue at risk, not client count at risk.
That one chart answers the only question that matters at a glance: how much of my book is at risk right now? Maybe you consider “at Risk” to be the Yellows plus the Reds.
And it surfaces the exposure you can't feel day to day. Larger, more mature agencies tend to retain clients noticeably better than smaller ones and the common explanation is process, not necessarily talent. Structured account management, not smarter people. A useful rule of thumb worth keeping in mind: if your annual turnover gets over 20%, assume that another chunk of your book is already at risk and you just can't see it yet. The red/yellow/green view is how you see it.
The Get-Well Plan: Turning Every "No" Into a To-Do
Here's where the scorecard becomes useful: it needs to drive actual behavior change in your firm.
Every element scored low is automatically a to-do, not just a data point.
No strategy one-pager? To-do: build one this month. Contact went quiet? To-do: get an exec check in call on the calendar. Team hates the account? To-do: figure out why before the client feels it.
But — and this is the discipline — you work one move at a time. Pick the single highest-impact action for the next 30 days per at-risk client. Close it. Then move to the next. Resist the temptation to build a 14-item rescue plan you'll never finish. One move, monthly, and then the risk score move.
That monthly review is the feedback loop that makes the whole thing worth building. If you want more structure around follow-through, borrow the "wildly important goal" cadence from The 4 Disciplines of Execution. It's a clean way to keep the get-well work from getting buried under client delivery.
OK. So, why bother? Because the payoff is meaningful. Even modest improvements in retention can produce outsized gains in revenue growth and profitability because existing accounts are often more profitable than new ones and acquisition costs are front-loaded. Early churn kills clients right before they'd have become your most valuable. You're not just losing revenue and profit. You're losing it at the worst possible moment.
Retention Is a Discipline, Not a Project
I'll leave you with the mindset, because the tool doesn't work without it.
Retention is a journey, not a destination. There's always a next move to strengthen a relationship, no matter what the score says today. The whole point of the scorecard is to stop waiting for a client to turn yellow (or red) before you act.
The urgency is real: yellow flagged clients have a habit of turning red over time. The problem is that it can happen slowly and you and your team are busy. That's drift. And drift is exactly what a scorecard reviewed monthly, and not just at renewal, is built to catch.
So start simple. Twelve elements. Four buckets. One number, one chart, one move per at-risk client. You can always add complexity later.
Your gut got you this far. Now give it a system.